ColdFusion Error Log
Contents
What is the ColdFusion Error Log?
There are two types of logs that could contain information about your site. First on the list here is the Server error logs, and the second is logs created by using the cflog tag..
- 'ColdFusion Server Errors': The errors reported here are errors that your site are throwing in ColdFusion. NOTE: Our production servers should not be used for development, so you should be doing your development work on your local machine. However, if your site is throwing an error, this will give you the ability to see that error.
- 'cflog tag logging': NOTE: We strongly suggest to not use the "information" type. We also suggest to only set the type to "error" or "fatal" on the production servers. ColdFusion writes the logs to a system path. For security purposes, your cflog logs will only appear here if you have given the file name in the cflog tag the name of your domain, without the www. For example, if your domain is your_domain.com you would set the file attribute for the cflog tag like: file="your_domain.com"
How to access the ColdFusion error logs in WCP
We'll share the steps needed to get to the ColdFusion error logs below:
First login to your WCP control panel for the account the domain is under: https://wcp.hostek.com
If you have any issues with logging into WCP then please see our tutorials on recovering your password if necessary
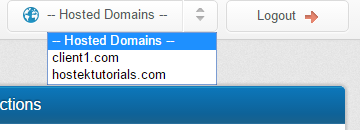
Once logged into WCP if you have multiple domains you may need to select the appropriate domain to manage using the 'Hosted Domains' drop-down in the top-right of the page as shown in the screenshot below:

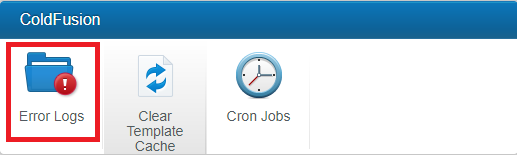
Once in the correct domains WCP control panel click on the 'ColdFusion Error Logs' icon under the 'ColdFusion' section.
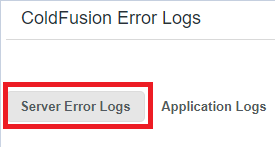
Choose the Server Error Logs tab..
'Wrap Text'
'Hours'
Click the 'Update' button.
'Server Error Logs' text box.
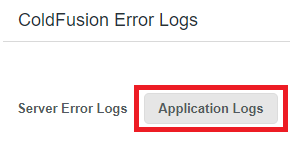
Choose the Application Error Logs tab.
'Wrap Text'
'Hours'
'Purge Logs'
Click the 'Update' button.
'Application Logs' text box.

View Server Error Logs

This will allow the error text to be wrapped within the text frame to prevent the need for scrolling to see the entire message.

Allows you to choose the amount of hours you wish to view logs for. (1-24 hours)

This will populate the Server Error Logs text box with any related error logs.

This box will display the server error logs for your domain within the time frame you have choosen.

View Application Error Logs

This will allow the error text to be wrapped within the text frame to prevent the need for scrolling to see the entire message.
Allows you to choose the amount of hours you wish to view logs for. (1-24 hours)
The purge logs button allows you to clear out all application error logs for your domain.

This will populate the Server Error Logs text box with any related error logs.
This box will display the server error logs for your domain within the time frame you have choosen.
